Search

Tuesday, June 12, 2012

SQL Server: Database Snapshots !!

A database snapshot is a read-only, static view of a database (the source database). Multiple snapshots can exist on a source database and always reside on the same server instance as the database. Each database snapshot is transactionally consistent with the source database as of the moment of the snapshot’s creation. A snapshot persists until it is explicitly dropped by the database owner.
Snapshot database operates at page level. When Snapshot database is created, it is produced on sparse files, it does not occupy any space in the Operating System. When any data page is modified in the source database, that data page is first copied to Snapshot database, making the sparse file size increases. For unchanged pages, it still fetches the data from the actual database.
Lets see how database snapshot works by a practical example. Let us first create the source database to prepare environment.
CREATE DATABASE Test
USE Test
GO
CREATE TABLE Test_Table(ID INT,Name VARCHAR(15))
GO
INSERT INTO Test_Table VALUES
(1,‘A’),
(2,‘B’),
(3,‘C’)
Select * from Test_Table
So we have the table and all the records inserted in it. Lets first look at the size of the database that we created above.
EXEC sp_spaceused
Lets also look at the physical file size of the .mdf file.
Lets create the SNAPSHOT of the database:
USE master
CREATE DATABASE TEST_SS
ON
(NAME=TEST,
FILENAME=‘C:\Subhro\TEST_SS.ss’
)
AS SNAPSHOT OF TEST
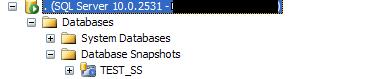
The above statement creates a snapshot which can be found here:
Lets check the size of the snapshot:
USE TEST_SS
GO
EXEC sp_spaceused
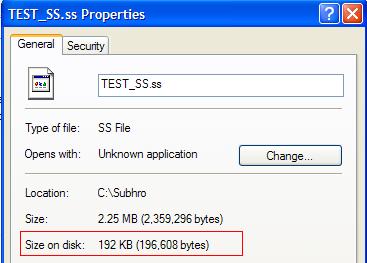
The space used details shown above are of the “Test” database which the snapshot is pointing to, and to confirm the observation, if we go to C:\Subhro\TEST_SS.ss and right-click for Properties, we will see what is shown below. The actual size occupied by the snapshot is merely a 192 KB.
Lets insert few records in the source database Table:
USE Test
GO
INSERT INTO Test_Table VALUES
(4,‘D’),
(5,‘E’),
(6,‘F’)
Select * from Test_Table
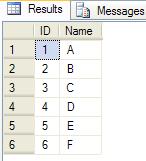
Lets check the records from the Snapshot:
USE TEST_SS
GO
Select * from Test_Table
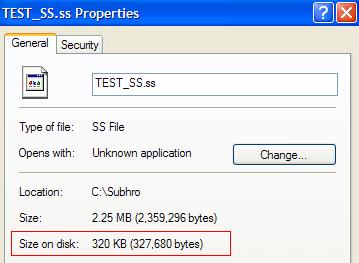
Lets take a look at the physical size of the Snapshot File again:
We observe that the size of the snapshot has increased; this is because of the page being copied to the snapshot. The page holding the Test table’s three records got copied into the snapshot when we added additional records into it.
This was all about database Snapshot. One final test, let’s try to restore the database from Database Snapshot:
USE master
RESTORE DATABASE TEST
FROM DATABASE_SNAPSHOT = ‘TEST_SS’
Finally, lets again check the records in the Test_table:
select * from test_table
So we can see that all the records that were inserted after creating the snapshot have been rolled back when we restored the database from Snapshot.

SQL Server 2000: TempDB Disk is Full !!

As it was SQL Server 2000 instance so the available options to us is little limited. So at first I wanted to SHRINK the log file that was around 98% FULL. I used the following command:
USE tempdb
GO
DBCC SHRINKFILE (‘templog’, 1024)
The command ran successfully. But there was no change in database size.
So then my next step was to find any uncommitted transactions, which is not letting me to shrink the log.. for that I use the following command:
DBCC OPENTRAN (‘tempdb’)
There was one SPID that was running for last two days. Now I had to see what that SPID is doing. For that, I used the following query:
DBCC INPUTBUFFER (SPID)
It was a SELECT query that was running for last 2 days. It was using SORT operation on the result set. By that time TempDB log was around 99% full.
I used the following command to KILL the culprit SPID:
KILL
After this, again I tried to SHRINK the database log file with the following command:
DBCC SHRINKFILE (‘templog’, 1024)
Bang. It was done. Now the log file was around 2% full.
This is a solution for emergency situations. For long-term solution, try to use the Proper file sizes and add log files if needed. Please create right indexes on tables.

SQL Server Deadlock Priority Configuration


The DEADLOCK_PRIORITY option dictates how the spids are handled when a deadlock occurs. The default deadlock priority in SQL Server 2000 and 2005 is NORMAL. SQL Server 2000 has two other settings of LOW and HIGH, whereas SQL Server 2005 has 21 settings based on a numeric priority. With this being said, SQL Server scans for deadlocks on a regular basis (i.e. every 5 seconds in SQL Server 2005) and the following logic is used to determine the victim of a deadlock:

  1. If the DEADLOCK_PRIORITY for one of the spids is lower than the other, the lower priority spid is chosen as the victim
  2. If the DEADLOCK_PRIORITY is the same for each spid involved, the spid that is less expensive/costly to rollback is chosen as the victim.

During this scanning process is where the DEADLOCK_PRIORITY comes in handy. This configuration is set at run time, not at parse time. So once you have done the analysis for your application you will know which portions of code will either succeed or fail based on the DEADLOCK_PRIORITY. Below is an example of setting the DEADLOCK_PRIORITY in SQL Server 2005 for two different pieces of code to ensure you are able to control the outcome of the deadlock by ensuring the INSERT completes and the SELECT is the deadlock victim:

SET DEADLOCK_PRIORITY LOW
GO
EXEC dbo.spGetAllOrders
GO
SET DEADLOCK_PRIORITY HIGH
GO
EXEC dbo.spInsertOrders
GO


   Syntax:      


SET DEADLOCK_PRIORITY { LOW | NORMAL | HIGH | | @deadlock_var | @deadlock_intvar }


::= { -10 | -9 | -8 | … | 0 | … | 8 | 9 | 10 }


Arguments:

LOW

Specifies that the current session will be the deadlock victim if it is involved in a deadlock and other sessions involved in the deadlock chain have deadlock priority set to either NORMAL or HIGH or to an integer value greater than -5. The current session will not be the deadlock victim if the other sessions have deadlock priority set to an integer value less than -5. It also specifies that the current session is eligible to be the deadlock victim if another session has set deadlock priority set to LOW or to an integer value equal to -5.

NORMAL

Specifies that the current session will be the deadlock victim if other sessions involved in the deadlock chain have deadlock priority set to HIGH or to an integer value greater than 0, but will not be the deadlock victim if the other sessions have deadlock priority set to LOW or to an integer value less than 0. It also specifies that the current session is eligible to be the deadlock victim if another other session has set deadlock priority to NORMAL or to an integer value equal to 0. NORMAL is the default priority.

HIGH

Specifies that the current session will be the deadlock victim if other sessions involved in the deadlock chain have deadlock priority set to an integer value greater than 5, or is eligible to be the deadlock victim if another session has also set deadlock priority to HIGH or to an integer value equal to 5.


Is an integer value range (-10 to 10) to provide 21 levels of deadlock priority. It specifies that the current session will be the deadlock victim if other sessions in the deadlock chain are running at a higher deadlock priority value, but will not be the deadlock victim if the other sessions are running at a deadlock priority value lower than the value of the current session. It also specifies that the current session is eligible to be the deadlock victim if another session is running with a deadlock priority value that is the same as the current session. LOW maps to -5, NORMAL to 0, and HIGH to 5.

@ deadlock_var

Is a character variable specifying the deadlock priority. The variable must be set to a value of 'LOW', 'NORMAL' or 'HIGH'. The variable must be large enough to hold the entire string.

@ deadlock_intvar

Is an integer variable specifying the deadlock priority. The variable must be set to an integer value in the range (-10 to 10).

Remarks:

Deadlocks arise when two sessions are both waiting for access to resources locked by the other. When an instance of SQL Server detects that two sessions are deadlocked, it resolves the deadlock by choosing one of the sessions as a deadlock victim. The current transaction of the victim is rolled back and deadlock error message 1205 is returned to the client. This releases all of the locks held by that session, allowing the other session to proceed.

Which session is chosen as the deadlock victim depends on each session's deadlock priority:

·         If both sessions have the same deadlock priority, the instance of SQL Server chooses the session that is less expensive to roll back as the deadlock victim. For example, if both sessions have set their deadlock priority to HIGH, the instance will choose as a victim the session it estimates is less costly to roll back.

·         If the sessions have different deadlock priorities, the session with the lowest deadlock priority is chosen as the deadlock victim.

SET DEADLOCK_PRIORITY is set at execute or run time and not at parse time.


Permission:

Require membership in the public role.

Examples:

The following example uses a variable to set the deadlock priority to LOW.

DECLARE @deadlock_var NCHAR(3);

SET @deadlock_var = N'LOW';

SET DEADLOCK_PRIORITY @deadlock_var;

GO

The following example sets the deadlock priority to NORMAL.

SET DEADLOCK_PRIORITY NORMAL;

GO

Detecting and Ending Deadlocks

 A good link  for detecting and ending deadlocks.

http://msdn.microsoft.com/en-us/library/ms178104(SQL.105).aspx.

Locking and Blocking Scripts in SQL Server 2000 vs SQL Server 2005

SQL Server 2000
In SQL Server 2000 the main stored procedure to find out which locks were issued was sp_lock. Typically this command was followed by sp_who2.In order to find out more information about the spid in terms of the user, host name, application, CPU and memory utilization either DBCC INPUTBUFFER or fn_get_sql was issued to find out exactly what code was being issued.If you ar eunable to find the required result then you might look into master.dbo.syslockinfo table and/or the master.dbo.sysprocesses table, although this was not always the recommended approach.


SQL Server 2000 - Locking Related Objects
ID
Object
Example
1
sp_lock - System stored procedure to identify all of the locks issued across the SQL Server instance
EXEC master.dbo.sp_lock
GO
2
sp_who and sp_who2 - System stored procedure to identify all of the processes across the SQL Server instance
EXEC master.dbo.sp_who2
GO
3
master.dbo.syslockinfo - System table with the locks issued across the SQL Server instance
SELECT req_spid AS 'spid',
DB_NAME(rsc_dbid) AS 'Database',
OBJECT_NAME(rsc_objid) AS 'Name',
rsc_indid AS 'Index',
rsc_text AS 'Description',
ResourceType = CASE WHEN rsc_type = 1 THEN 'NULL Resource'
WHEN rsc_type = 2 THEN 'Database'
WHEN rsc_type = 3 THEN 'File'
WHEN rsc_type = 4 THEN 'Index'
WHEN rsc_type = 5 THEN 'Table'
WHEN rsc_type = 6 THEN 'Page'
WHEN rsc_type = 7 THEN 'Key'
WHEN rsc_type = 8 THEN 'Extent'
WHEN rsc_type = 9 THEN 'RID (Row ID)'
WHEN rsc_type = 10 THEN 'Application'
ELSE 'Unknown'
END,
Status = CASE WHEN req_status = 1 THEN 'Granted'
WHEN req_status = 2 THEN 'Converting'
WHEN req_status = 3 THEN 'Waiting'
ELSE 'Unknown'
END,
OwnerType =
CASE WHEN req_ownertype = 1 THEN 'Transaction'
WHEN req_ownertype = 2 THEN 'Cursor'
WHEN req_ownertype = 3 THEN 'Session'
WHEN req_ownertype = 4 THEN 'ExSession'
ELSE 'Unknown'
END,
LockRequestMode =
CASE WHEN req_mode = 0 THEN 'No access '
WHEN req_mode = 1 THEN 'Sch-S (Schema stability)'
WHEN req_mode = 2 THEN 'Sch-M (Schema modification)'
WHEN req_mode = 3 THEN 'S (Shared)'
WHEN req_mode = 4 THEN 'U (Update)'
WHEN req_mode = 5 THEN 'X (Exclusive)'
WHEN req_mode = 6 THEN 'IS (Intent Shared)'
WHEN req_mode = 7 THEN 'IU (Intent Update)'
WHEN req_mode = 8 THEN 'IX (Intent Exclusive)'
WHEN req_mode = 9 THEN 'SIU (Shared Intent Update)'
WHEN req_mode = 10 THEN 'SIX (Shared Intent Exclusive)'
WHEN req_mode = 11 THEN 'UIX (Update Intent Exclusive)'
WHEN req_mode = 12 THEN 'BU. (Bulk operations)'
WHEN req_mode = 13 THEN 'RangeS_S'
WHEN req_mode = 14 THEN 'RangeS_U'
WHEN req_mode = 15 THEN 'RangeI_N'
WHEN req_mode = 16 THEN 'RangeI_S'
WHEN req_mode = 17 THEN 'RangeI_U'
WHEN req_mode = 18 THEN 'RangeI_X'
WHEN req_mode = 19 THEN 'RangeX_S'
WHEN req_mode = 20 THEN 'RangeX_U'
WHEN req_mode = 21 THEN 'RangeX_X'
ELSE 'Unknown'
END
FROM master.dbo.syslockinfo
GO
4
master.dbo.sysprocesses - System table with the process information across the SQL Server instance
SELECT *
FROM master.dbo.sysprocesses
GO


SQL Server 2005
In SQL Server 2005, these objects remain available but some are scheduled to be deprecated in SQL Server 2008 which means now is the time to make sure you transition your scripts prior to the SQL Server 2008 migration:
  • sp_lock - For backward compatibility only and expected to be deprecated in SQL Server 2008
    • Replacement (SQL Server 2005) = sys.dm_tran_locks
    • Expected Replacement (SQL Server 2008) = sys.syslock_information
  • sp_who and sp_who2 - Not expected to be deprecated in SQL Server 2008
  • master.dbo.syslockinfo - For backward compatibility only and expected to be deprecated in SQL Server 2008
    • Replacement (SQL Server 2005) = sys.dm_tran_locks
    • Expected Replacement (SQL Server 2008) = sys.syslock_information
  • master.dbo.sysprocesses - For backward compatibility only and expected to be deprecated in SQL Server 2008
    • Replacement (SQL Server 2005) = sys.dm_exec_connections, sys.dm_exec_sessions, sys.dm_exec_requests
      • Stay tuned for an upcoming tip on the mapping and opportunities with these three DMVs
With the sys.dm_tran_locks DMV in SQL Server 2005 functionally replacing sp_lock and master.dbo.syslockinfo a simple query can be issued to capture the pertinent locking related information. The resource related information (ResourceSubType, ResourceType, Request_Owner_Type, etc.) has all be provided as a descriptive name as opposed to having to write case statements to decipher the values. As such, this simplifies the overall querying as well as provides the opportunity to query supported objects and issue COUNT commands, determine specific lock types, etc.


SQL Server 2005 - master.sys.dm_tran_locks
-- Simple query to return all records and all columns
SELECT *
FROM master.sys.dm_tran_locks;
GO
-- Focused result set
SELECT resource_type, request_session_id, resource_database_id, resource_associated_entity_id, resource_subtype, resource_description, request_status, request_owner_type, request_mode
FROM sys.dm_tran_locks;
GO
-- Number of lock records per database
SELECT COUNT(*) AS 'NumberofLockRecords', DB_NAME(resource_database_id)
FROM master.sys.dm_tran_locks
GROUP BY resource_database_id;
GO
-- Query for specific lock types
SELECT resource_type, request_session_id, resource_database_id, resource_associated_entity_id, resource_subtype, resource_description, request_status, request_owner_type, request_mode
FROM sys.dm_tran_locks
WHERE resource_type IN ('PAGE', 'KEY', 'EXTENT', 'RID');
GO
SELECT tl.request_session_id, wt.blocking_session_id, DB_NAME(tl.resource_database_id) AS DatabaseName, tl.resource_type, tl.request_mode, tl.resource_associated_entity_id
FROM sys.dm_tran_locks as tl
INNER JOIN sys.dm_os_waiting_tasks as wt
ON tl.lock_owner_address = wt.resource_address;
GO


Different ways to find out the Blockings

There are number of ways to find out the details of the system processes IDs (spids) involved in blocking.

  • sp_who2 System Stored Procedure

  • sys.dm_exec_requests DMV

  • Sys.dm_os_waiting_tasks

  • SQL Server Management Studio Activity Monitor

  • SQL Server Management Studio Reports

  • SQL Server Profiler

  • Monday, June 11, 2012

    SQL Server script to rebuild all indexes for all tables and all databases

    DECLARE @Database VARCHAR(255)

    DECLARE @Table VARCHAR(255)

    DECLARE @cmd NVARCHAR(500)

    DECLARE @fillfactor INT

    SET @fillfactor = 90

    DECLARE DatabaseCursor CURSOR FOR

    SELECT name FROM MASTER.dbo.sysdatabases

    WHERE name NOT IN ('master','msdb','tempdb','model','distribution')

    ORDER BY 1

    OPEN DatabaseCursor

    FETCH NEXT FROM DatabaseCursor INTO @Database

    WHILE @@FETCH_STATUS = 0

    BEGIN

    SET @cmd = 'DECLARE TableCursor CURSOR FOR SELECT ''['' + table_catalog + ''].['' + table_schema + ''].['' +

    table_name + '']'' as tableName FROM ' + @Database + '.INFORMATION_SCHEMA.TABLES

    WHERE table_type = ''BASE TABLE'''

    -- create table cursor

    EXEC (@cmd)

    OPEN TableCursor

    FETCH NEXT FROM TableCursor INTO @Table

    WHILE @@FETCH_STATUS = 0

    BEGIN

    IF (@@MICROSOFTVERSION / POWER(2, 24) >= 9)

    BEGIN

    -- SQL 2005 or higher command

    SET @cmd = 'ALTER INDEX ALL ON ' + @Table + ' REBUILD WITH (FILLFACTOR = ' + CONVERT(VARCHAR(3),@fillfactor) + ')'

    EXEC (@cmd)

    END

    ELSE

    BEGIN

    -- SQL 2000 command

    DBCC DBREINDEX(@Table,' ',@fillfactor)

    END

    FETCH NEXT FROM TableCursor INTO @Table

    END

    CLOSE TableCursor

    DEALLOCATE TableCursor

    FETCH NEXT FROM DatabaseCursor INTO @Database

    END

    CLOSE DatabaseCursor

    DEALLOCATE DatabaseCursor

    SQL SERVER – Difference Between Index Rebuild and Index Reorganize

    Index Rebuild : This process drops the existing Index and Recreates the index.
    USE AdventureWorks;GOALTER INDEX ALL ON Production.Product REBUILD
    GO

    Index Reorganize : This process physically reorganizes the leaf nodes of the index.
    USE AdventureWorks;GOALTER INDEX ALL ON Production.Product REORGANIZE
    GO

    Recommendation: Index should be rebuild when index fragmentation is great than 40%. Index should be reorganized when index fragmentation is between 10% to 40%. Index rebuilding process uses more CPU and it locks the database resources. SQL Server development version and Enterprise version has option ONLINE, which can be turned on when Index is rebuilt. ONLINE option will keep index available during the rebuilding

    Recomplile all Stored Procedure of a Database

    DECLARE proccurs CURSOR
    FOR
        SELECT [name]
          FROM sysobjects
         WHERE xtype in ('p', 'v', 'fn')

    OPEN proccurs
    DECLARE @pname VARCHAR(60)

    FETCH NEXT FROM proccurs INTO @pname
    WHILE @@fetch_status = 0
    BEGIN

        EXEC sp_recompile @pname

        FETCH NEXT FROM proccurs INTO @pname
    END
    CLOSE proccurs
    DEALLOCATE proccurs

    Wednesday, May 23, 2012

    Some of the important performance counters related to memory in SQL Server are

    SQL Server Cache Hit Ratios: A consistent value below 90% indicates that more physical memory is needed on the server.
    Memory Object: Available Bytes: On a server dedicated to SQL Server, SQL Server attempts to maintain from 4-10MB of free physical memory. The remaining physical RAM is used by the operating system and SQL Server.
    Memory Object: Pages/Sec: Measures the number of pages per second that are paged out from RAM to disk. Higher the value, higher will be I/O activities and will result in decrease in performance. If you have only SQL server application running on the server then in most cases this value should be near zero. However you don’t see much performance degradation until it is 20, when SQL Server is not the only application. Above 20, it is an indication to have more RAM on the server.
    SQLServer:Memory Manager: Total Server Memory (KB):Tells you how much memory your SQL Server is currently using.
    SQLServer:Memory Manager: Target Server Memory (KB):Tells you howmuch memory SQL Server would like to use to operate efficiently. If the SQLServer:Memory Manager: Total Server Memory (KB) counter is more or equal than the SQLServer:Memory Manager: Target Server Memory (KB) counter, this indicates that SQL Server may be under memory pressure and could use access to more physical memory.
    SQL Server Buffer Manager Object: Cache Size (pages): Multiply this value by 8K to get the value of physical RAM devoted to SQL Server data cache. If this value is less than what you expect than SQL Server is starving on the memory and is not utilizing the available physical RAM.
    Process: Working Set: shows the amount of memory used by process. If this number is consistently below Min Server Memory and Max Server Memory then SQL Server is configured to use too much memory.

    When the system is running out of memory, it will have higher paging and disk I/O. You can measure the Memory: Page Faults/sec counter to make sure that the disk activity is not caused by paging. You can also monitor SQL Server:Buffer Manager:Page reads/sec and SQL Server:Buffer Manager:Page writes/sec performance counters. Check more at: http://msdn2.microsoft.com/en-us/library/ms175903.aspx.
    There is a relationship between SQL Server disk I/O and CPU usage. Check the article Monitoring CPU Usage - http://msdn2.microsoft.com/en-us/library/ms178072.aspx for more details.
    Following are other very useful articles for troubleshooting SQL Server performance.
    SQL Server Memory Monitoring - http://msdn2.microsoft.com/en-us/library/ms176018.aspx. This article also contains the list of performance counters for monitoring SQL Server memory. The Process: Working Set counter shows the amount of memory that is used by a process.

    Tuesday, May 15, 2012

    Killed Last 10 min Inactive Sessions of a Database

    DECLARE @DatabaseName nvarchar(50)

    SET @DatabaseName = N'DATABASE NAME'

    --SET @DatabaseName = DB_NAME()

    DECLARE @SQL varchar(max)

    SET @SQL = ''

    SELECT @SQL = @SQL + 'Kill ' + Convert(varchar, SPId) + ';'

    FROM MASTER..SysProcesses

    WHERE DBId = DB_ID(@DatabaseName) AND SPId <> @@SPId

    AND DATEDIFF(mi,last_batch,GETDATE())>=10

    -- SELECT @SQL

    EXEC(@SQL)

    Monday, May 14, 2012

    Findout the Fragmented Table and Index Name

    Step-1.
    CREATE FUNCTION dbo.index_name (@object_id int, @index_id int)
    RETURNS sysname
    AS
    BEGIN
      RETURN(SELECT name FROM sys.indexes WHERE object_id = @object_id and index_id = @index_id)
    END;

    Step-2.

    SELECT 
     OBJECT_NAME(object_id) AS tblName
    ,dbo.index_name(object_id, index_id) AS ixName
    ,avg_fragmentation_in_percent
    FROM sys.dm_db_index_physical_stats(DB_ID(), NULL, NULL, NULL, NULL)
    WHERE avg_fragmentation_in_percent > 20
    AND index_type_desc IN('CLUSTERED INDEX', 'NONCLUSTERED INDEX')

    Step-3:
    To fix execute:

    dbcc indexdefrag (ADVANTUREWORKS,'sales.storecontact',AK_StoreContact_rowguid)

    Thursday, May 10, 2012

    Get configuration values for instance

    SELECT name, value, value_in_use, [description]

    FROM sys.configurations

    ORDER BY name OPTION (RECOMPILE);

    Findout SQL is listening on which port

    USE master
    GO
    xp_readerrorlog 0, 1, N'Server is listening on'

    SQL 2005
    HKEY_LOCAL_MACHINE\SOFTWARE\Microsoft\Microsoft SQL Server\MSSQL.\MSSQLServer\
    SuperSocketNetLib\TCP\


    SQL 2008
    HKEY_LOCAL_MACHINE\SOFTWARE\Microsoft\Microsoft SQL Server\MSSQL10.\MSSQLServer\
    SuperSocketNetLib\TCP\